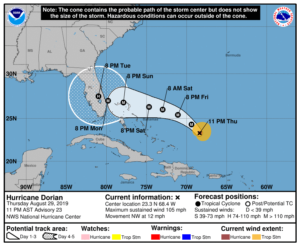
The National Hurricane Center (or NHC, which is part of the the National Weather Service, or NWS, which is itself part of the National Oceanic and Atmospheric Administration, or NOAA, for all you acronym geeks out there) puts out a standard graph whenever a hurricane or serious storm has developed. This graph, known as the hurricane forecast cone, hurricane track cone, storm forecast cone, storm track cone, or the cone of uncertainty, is quite recognizable and is often shared when in effect. In fact, we use part of one for Hurricane Irma from 2017 as the profile photo for the Facebook page of this very blog!
If you ever wanted to know how to read a hurricane forecast cone, this video from the NHC can guide you through understanding the cone.
Update Rate
One important thing is that when forecast cones are being published, there is a standard update time. The NHC publishes updates on 2, 5, 8, and 11 o’clock (AM and PM) Atlantic Standard Time (AST). AST is the same as Eastern Daylight (Savings) Time during the “Daylight Savings” months. Knowing when they update the hurricane forecast cone can ensure you have the most up-to-date forecast for better preparedness.
An important thing to remember is that the 2/3rds prediction rate means they’re wrong 1/3rd of the time. For example, once Hurricane Dorian hit the Bahamas (and hard, unfortunately), the original cone was wrong. It turned north, meaning the cone was not accurate past the 3 day mark.
And now that you understand it and know when you check for updates, you can be better prepared!
Interested in weather preparedness and want to support EDC/Prepared? If you purchase through the links on this site, I earn from Amazon Associates. Thanks for your support!
View our Privacy Policy here.
